Go beyond passive videos and static textbooks. Tweak regression lines in real time, step through K-Means clustering, optimize SQL pipelines with Python pandas, and test statistical distributions — all 100% offline with zero tracking.
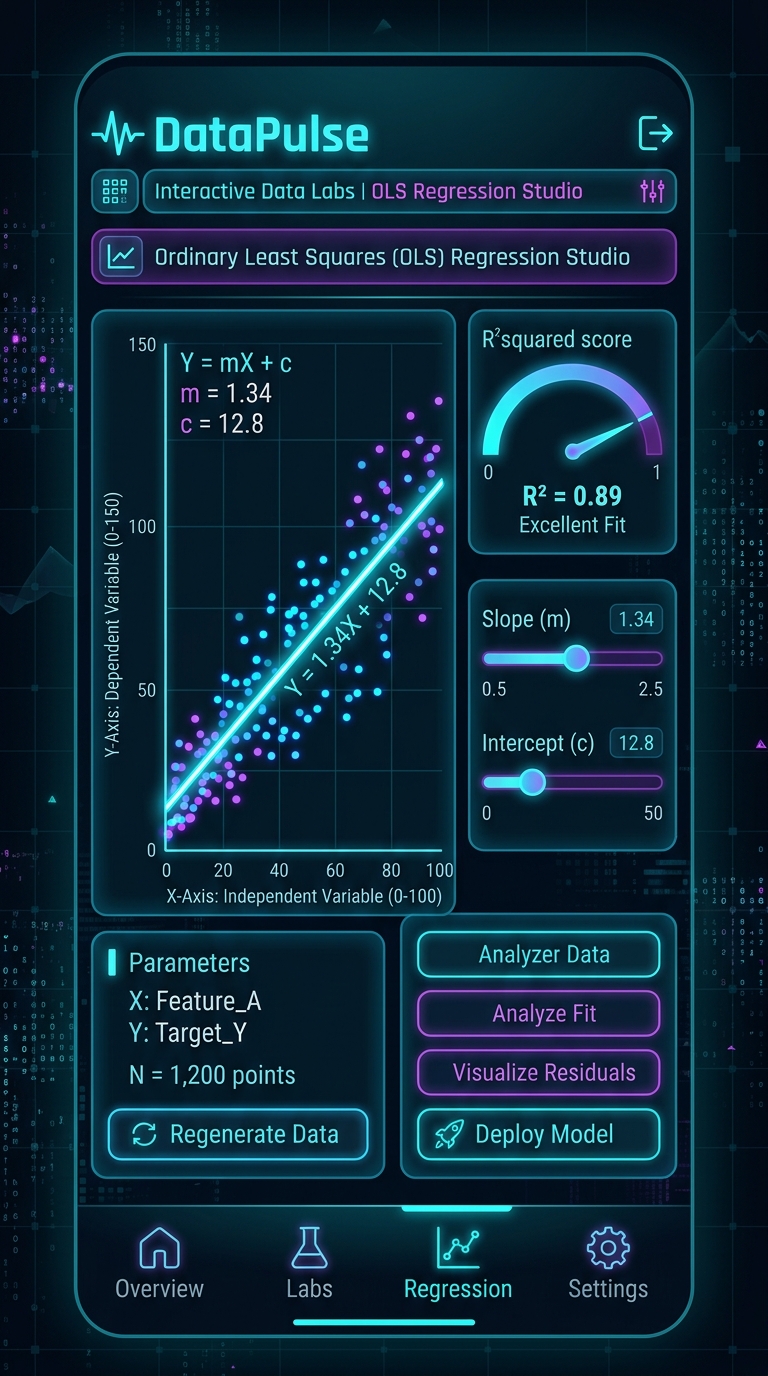
Experience mathematical concepts and algorithms visually. Adjust parameters and watch equations, clusters, and code update synchronously.
Used in sales forecasting, pricing optimization, and trend analysis.
Tap the coordinate plane to plot custom data points and watch real-time Ordinary Least Squares (OLS) calculate best-fit slope, intercept, and R² variance. Move the predictive slider to project Ŷ for any new X value with live residual error drop-lines.
Ŷ = β₀ + β₁X + ε | R² = 1 - (SS_res / SS_tot)
Drag the sliders below to simulate actual model predictions and see classification metrics recalculate instantaneously:
💡 Pro-tip from Chapter 7: When evaluating cancer or medical alerts, prioritize Recall to minimize False Negatives. In spam filtering, prioritize Precision to avoid missing critical business emails.
A sequential roadmap designed specifically for aspiring analysts, transitioning professionals, and university students.
The analytics lifecycle, Descriptive vs Diagnostic vs Predictive vs Prescriptive, business KPIs vs vanity metrics, and industry roles.
Central tendency, variance, standard deviation, Gaussian normal distributions, Central Limit Theorem, and hypothesis testing.
Dynamic array formulas, XLOOKUP, INDEX-MATCH, Pivot Tables, calculated fields, data sanitization, and automated cleaning pipelines.
From SELECT to complex Window Functions, Common Table Expressions (CTEs), multi-table JOINs, subqueries, and query indexing optimization.
NumPy vectors, pandas DataFrames, conditional filtering, GroupBy aggregations, exploratory data analysis (EDA), and Seaborn charts.
Visual encoding principles, chart selection matrix, Power BI, Tableau, DAX calculations, and executive dashboard layout heuristics.
Ordinary Least Squares regression, logistic classification, decision boundaries, K-Means clustering, and ROC-AUC evaluation curves.
Transforming raw metrics into compelling executive business narratives. Pyramid Principle, slide design, and handling leadership Q&A.
End-to-end retail and churn case studies, GitHub portfolio README templates, resume optimizations, API ingestion, and data ethics/PII governance.
Built directly into the mobile app so you never have to search StackOverflow or Google when writing queries or preparing for interviews.
Crafted with Flutter for 60fps fluid interactions, dark mode comfort, and tactile feedback.
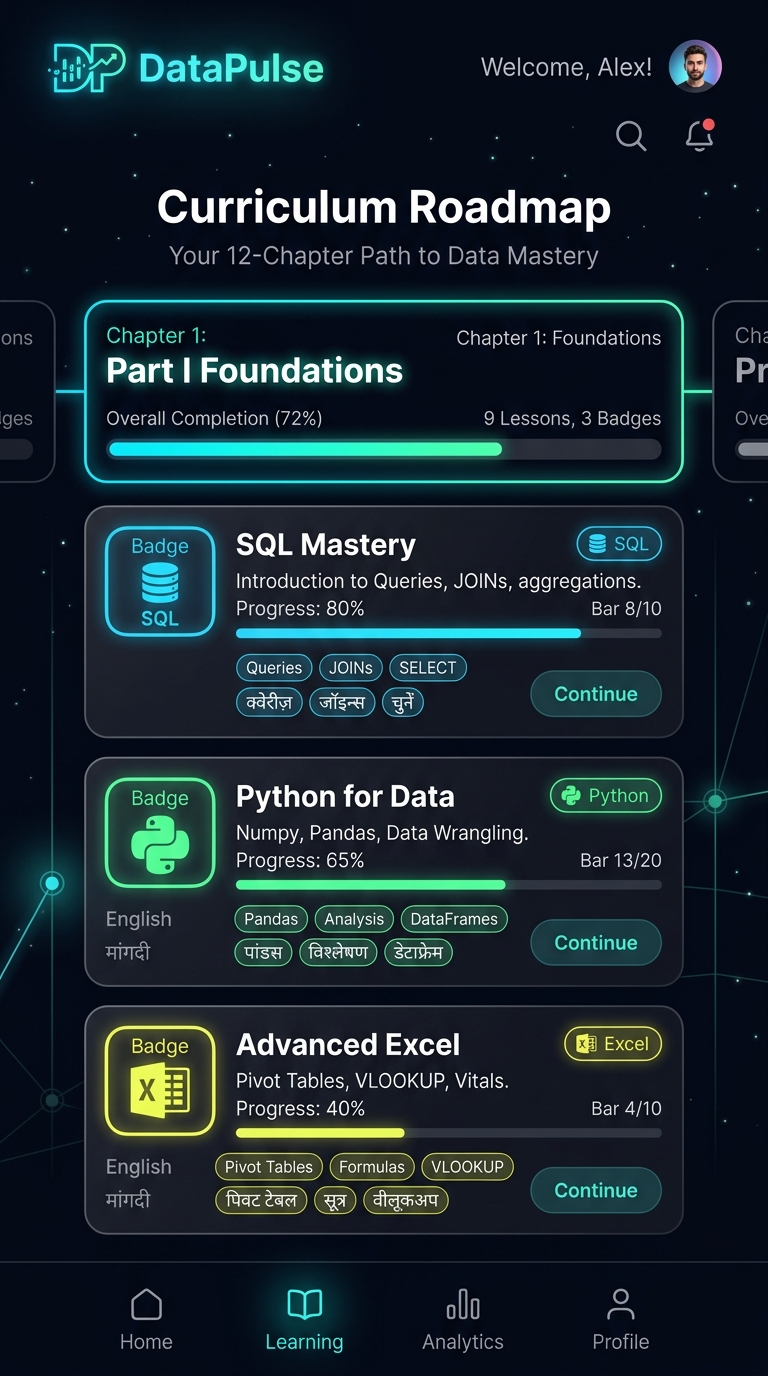
Step-by-step sequential learning with quick audio readouts.
Dynamic charts, draggable sliders, and live OLS regression.
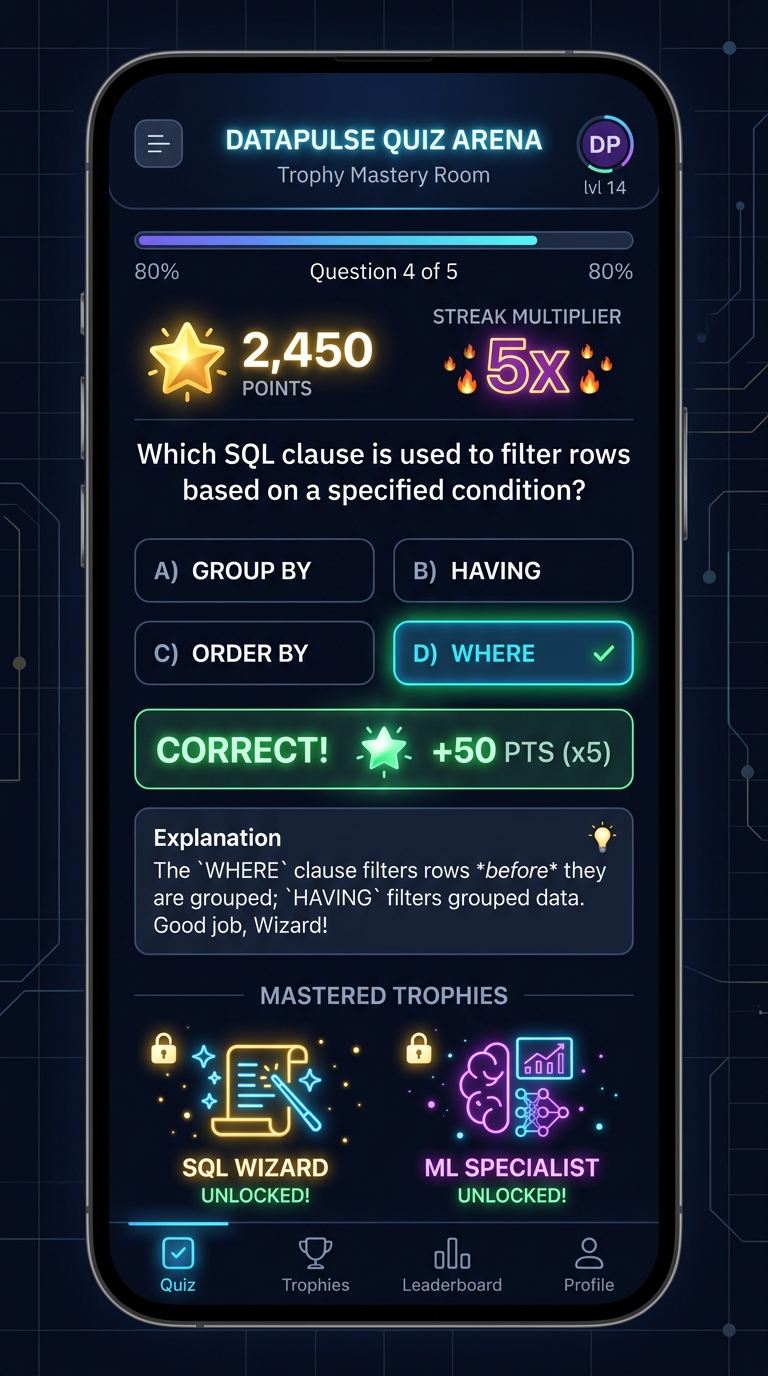
Streak multipliers, badges, and instant answer reviews.
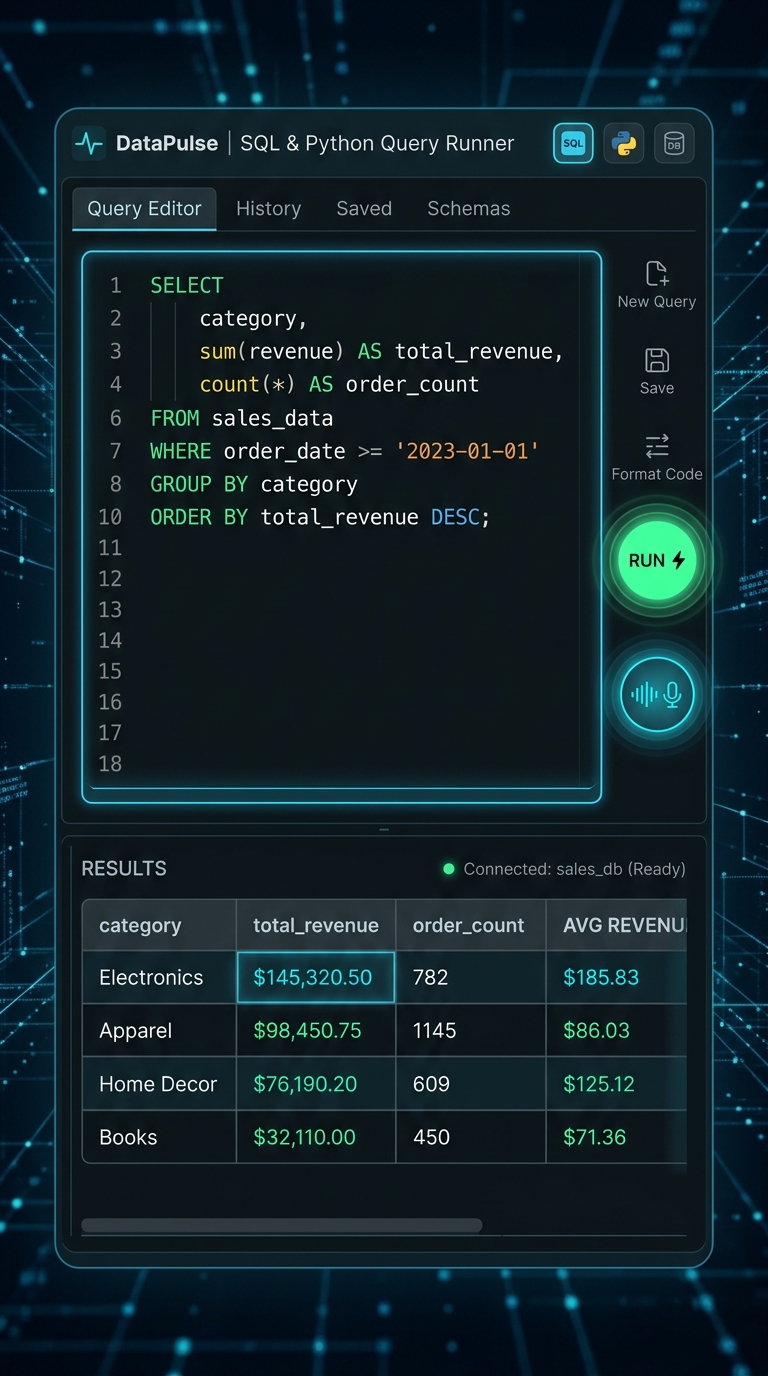
Dual output generating SQL queries and pandas scripts.
Everything you need to know about DataPulse, offline learning, and privacy.
Yes, 100%! DataPulse is built offline-first. All 12 chapters, 6 interactive data laboratories, and 15 cheat sheet appendices are compiled directly into the application. You can study on flights, metro commutes, or in areas with zero reception.
No prior coding experience is required. Part I starts with foundational concepts (what is data analytics, descriptive statistics, and basic metrics) before progressing gradually into Excel, SQL, and Python. Every concept is accompanied by visual simulations.
DataPulse is completely free with zero ads, zero subscriptions, and zero paywalls. Our mission is to provide an accessible, high-performance companion app for learners worldwide.
Never. DataPulse does not require account creation, social logins, or email verification. Your quiz progress and bookmarks remain strictly on your local device.
We do not collect, store, transmit, or sell any personal data. Please review our full Privacy Policy for complete details.